

RescueSF Tenderloin Emergency Dashboard
The End of Crisis Operations: What Happened?
When the Mayor announced the Tenderloin Emergency Plan on December 14, 2021, the Department of Emergency Management ("DEM") was tasked with coordinating the City's multi-agency response. The initial stage of the Tenderloin Initiative was seen as the crisis operations phase, during which the priority was on quickly launching and coordinating the City's programs. On July 3, the crisis operations phase came to a close, and the Tenderloin Initiative transitioned to the sustained operations phase. With this transition to sustained operations, overall coordinating responsibility transferred from DEM to the Planning Department.
As the City considers how to adjust the Tenderloin Initiative during the sustained operations phase, we have prepared this evaluation of the Initiative's results during the crisis operations phase, from December 2021 through July 3, 2022. How effective was the Tenderloin Emergency Initiative at accomplishing its goals?
Reduce Drug Sales and Violent Crime
-
When the City launched the Tenderloin Initiative, supporters hoped the effort would significantly reduce drug sales and crime, while critics feared excessive police action against drug users. Neither outcome has come about. The data shows modest levels of arrests for drug sellers, but not drug users, which is consistent with the stated focus on reducing drug trafficking. However, the data is too limited to evaluate the City’s real progress.
-
First, the City hasn’t released data on the final disposition of these arrests. How many arrests led to convictions, and how many arrested suspects returned to the streets? Drug dealing in the Tenderloin won’t decline until arrests have consequences.
-
Second, arrest and conviction rates are only proxies for what we really care about – the prevalence of open-air drug dealing. To demonstrate success, the City needs to create a more direct measure of drug dealing, for example by recording observations of street activity or even through public opinion polling.
Reduce Homelessness and Street Sleeping
-
As of July 3, the City had successfully helped 1,253 people exit street sleeping since the start of the Tenderloin Initiative. The vast majority of those people – 1,055 individuals – were initially moved to shelter, which means that they still need to find permanent housing. The City achieved significant results during these six months. At the same time, more information would allow a deeper assessment of the City’s efforts.
-
First, we do not know how many people are currently unsheltered in the Tenderloin and the rest of the City. The results of the Point-in-Time count from February are just now being released, but that data will only be accurate as of a single night in February. The City does not conduct regular counts of unsheltered people, which means that we do not know how many people currently remain on the streets.
-
Second, we know that the biggest obstacle to helping people move off of the streets is the lack of sufficient shelter and housing. While the City is expanding its shelter capacity, we need to know how many people are currently on the streets in order to determine how much more shelter and housing the City should provide.
-
And third, the City’s tent counts show that while the number of tents is declining in the Tenderloin, the number of tents is increasing in the rest of the City. This data suggests that some of the positive results in the Tenderloin may reflect the displacement of unsheltered people to other neighborhoods in the City.
Eliminate Widespread Public Drug Usage
-
The City’s main strategy for reducing public drug usage in the Tenderloin is to offer the Linkage Center as a safe consumption site where people can safely use drugs off of the city streets. Through July 3, the Linkage Center had a total of 62,733 visits, representing 2,614 weekly visits. This data doesn’t actually measure what we care about – the extent of public drug usage. Are visits to the Linkage Center reducing public drug usage? To evaluate real progress on this goal, the City needs a more direct measure of public drug usage such as structured observations or even an indirect measure such as public opinion polling.
Reduce Fatal and Non-Fatal Overdoses
-
One of the main justifications for launching the Tenderloin Emergency Initiative in December 2021 was to reduce the high level of accidental drug overdose deaths seen in the Tenderloin. Based on the reported data, the City appears to be relying primarily on the use of Naloxone to reverse overdoses. What we’re not seeing is evidence of the City trying to prevent overdoses by reducing substance abuse. The reported data on this goal does not include any data on treatment programs. Moreover, the data for the separate goal of increasing connections to care shows that the City is connecting very few people to drug treatment programs.
-
Before the launch of the Tenderloin Initiative, from September to December 2021, the Tenderloin saw an average of 9 accidental overdose deaths per month. During the Emergency Operations Period, accidental overdose deaths in the Tenderloin increased to 11 per month. While these figures may have been worse without the City's efforts, it's clear that the City did not achieve one of its primary objectives of reducing overdoses.
Increase Connections to Care
-
Many Tenderloin residents, especially unhoused residents, have significant physical and behavioral health needs. Unfortunately, the data shows that the City has so far had shockingly limited success connecting people to care. Through July 3, the Linkage Center reported 62,733 visits but only made 532 referrals for behavioral health services, representing just 0.8% of total visits.
For background on the Tenderloin Emergency Plan and an evaluation of the City's weekly reports, visit our first blog post on the dashboard.
Below, we present commentary and data on each of the eight goals of the City's Tenderloin Emergency Initiative.
1. Reduce Drug Sales and Violent Crime
-
Since the start of the Tenderloin Initiative, total calls for police service declined from 1,336 for the week ending January 23 to 1,128 for the week ending July 3, representing a drop of 16%. Since the start of January, the police averaged 9 booked arrests for drug sales or possession with intent to sell in the Tenderloin. The police made a total of 245 booked arrests, but there is no data regarding the final disposition of these cases. How many of the arrests actually led to convictions, and how many suspects returned to the streets?
-
From the start of January to the week ending July 3, the police on average seized 1,524 total grams of narcotics each week, including 951 grams of fentanyl. To put these figures in context, it would be helpful to have even a sense of the total amount of narcotics sold in a typical week. Are these drug seizures making a difference? The City hasn't answered this question.
.png)

Cumulative Booked Arrests: 245
.png)
2. Reduce Homelessness and Street Sleeping
-
From the start of the Tenderloin Initiative until the week ending July 3, the City helped 1,253 people exit street sleeping by placing 1,085 people into shelter and 198 people into housing. On average, each week the City placed 18 people into shelter and 8 into housing. The graphs show significant variation week to week on account of fluctuations in the availability of shelter and housing.
-
The City reports periodic data on tent counts. The data shows a slight decline in the total number of tents in the Tenderloin before the start of the initiative, from 77 in June 2021 to 60 in November 2021, while tents in the rest of the city increased from 310 in June 2021 to 466 in November 2021. Tents in the Tenderloin declined from 60 in November 2021 to 35 in March 2022, while tents in the rest of the city increased from 466 in November 2021 to 566 in March 2022. In other words, the launch of the Tenderloin Initiative saw a reduction of 25 tents in the Tenderloin but an increase of 100 tents in the rest of the city. These figures suggest that some of the decline of tents in the Tenderloin represented a displacement of tents to other parts of the city.
.png)
Cumulative Shelter Placements: 1,055
.png)
Cumulative Housing Placements: 198
.png)
.png)
3. Eliminate Widespread Public Drug Usage
-
Through the week of July 3, the Linkage Center had 62,733 total visits and averaged 2,614 weekly visits. This data shows increasing numbers of visits to the Linkage Center, but it doesn’t actually measure what we care about – the extent of public drug usage. Are visits to the Linkage Center reducing public drug usage? To evaluate real progress on this goal, the City needs a more direct measure of public drug usage such as structured observations or even an indirect measure such as public opinion polling.
.png)
4. Increase Safe Passage and Accessibility
-
Up until April 10, the City reported the number of streetlight repairs and curb and sidewalk repairs completed each week. After April 10, the City reported the number of new service requests filed each week and the percent of service requests closed within seven days. This new data is unhelpful because the City no longer revealed basic data on what we care about -- the number of repairs City staff are completing each week.
-
The previous data series revealed that, as of April 10, the City on average was repairing 10 streetlights and 6 curbs and sidewalks, each week.
-
This data shows what the City is doing to improve accessibility, but it doesn’t demonstrate that the City is actually succeeding. Are the Tenderloin’s streets safer and more accessible? To answer this question, the City would need a more direct measure of safe passage and accessibility, such as structured observations, or even an indirect measure, such as public opinion polling.
.png)
5. Cleaner Sidewalks and Streets
-
To ensure cleaner sidewalks and streets, the City removes trash and conducts power washings. From the start of the Tenderloin Initiative to the week ending April 3, the City removed an average of 196 tons of waste. From the week ending April 10 to the week ending June 26 -- the last available data -- the City removed an average of 131 tons of waste. Why did the volume of removed waste decline? Is the City saying that the Tenderloin suddenly became cleaner and produced less waste? The City also conducted an average of 96 power washings per week.
-
This data records the City’s activities, but, as with other goals, it does not show whether the City is succeeding. To know whether the streets are actually cleaner, the City would need to measure street cleanliness, either by recording qualitative observations or by conducting a public opinion poll.
.png)
.png)
6. Reduce Fatal and Non-fatal Overdoses
-
Through the week ending June 19 -- which is the last reported data -- the City’s emergency medical services (EMS) staff each week reversed an average of 27 overdoses in the Tenderloin and 21 in the rest of the City. From December through June, EMS staff reversed a total of 1,287 overdoses – 721 in the Tenderloin and 566 in the rest of the city. From the start of January through June, the City distributed 5,659 doses of Naloxone.
-
Has the City successfully reduced the number of overdose deaths? Before the start of the Tenderloin Initiative, during the last three months of 2021, on average there were 9 overdoses per month in the Tenderloin and 43 per month in the rest of the city. During the crisis operations phase of the Tenderloin Initiative, from January through the last reported data in June, on average there were 11 accidental overdose deaths per month in the Tenderloin and 39 per month in the rest of the city.
-
Therefore, during the crisis operations phase of the Tenderloin Initiative, accidental overdose deaths per month slightly increased in the Tenderloin and slightly fell in the rest of the city. What we don’t know is what these numbers would have been without all of the additional effort to reduce overdoses. For example, the number of overdose deaths could have been much higher. Even so, since reducing overdose deaths was one of the main goals of the Tenderloin Initiative, it is clear that the City did not achieve this goal.

Cumulative EMS Overdose Reversals in Tenderloin: 721
Cumulative EMS Overdose Reversals in Rest of City: 566
.png)
.png)
Cumulative Naloxone Doses Distributed: 5,659
.png)

7. Eliminate Widespread Street Vending
The weekly report does not contain data measuring progress on reducing illegal vending.
8. Increase Connections to Care
-
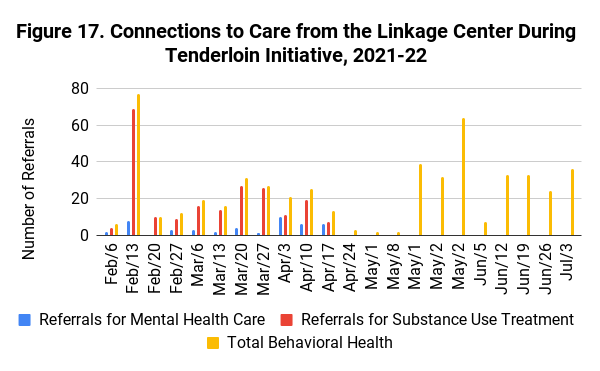
The data suggests that connecting people to care has actually not been a high priority. Through July 3, the Linkage Center reported 62,733 visits but only made 532 referrals for behavioral health services, representing just 0.8% of total visits. Figure 17 shows that the total number of weekly behavioral health referrals was higher after May 1, but were usually less than 40 per week.
-
We note that starting with the report for the week ending April 24, the City’s reports only showed an aggregate number for behavioral health referrals and no longer reported the separate data for referrals for mental health care and substance use treatment. This change in reporting has been unhelpful. For example, it is very useful to know the number of referrals to substance use treatment to assess the City’s efforts to reduce overdoses. The new figures make this analysis impossible.
-
The City also reports connections to care from Felton Institute’s Street Team and Community Health Equity Team. The reported data aggregates medical, mental health, and substance use referrals, making it impossible to identify the number of behavioral health referrals. We suggest that the City disaggregate the data to show the number of referrals to mental health care and to substance use treatment.
-
And finally, all of this data is even less clear because of the vague definition of “referral.” At present, the City defines a referral as a conversation about connecting someone to a service. The City cannot confirm that the individual actually received the service.
-
To show success on this important goal, the City needs to report how many people were actually connected to a specific medical or behavioral health service. All of the service teams – whether operated by the City or an outside organization – should use the same definitions and report comparable data.
Cumulative Linkage Center Behavioral Health Referrals: 532
As Percent of Total Visits to Linkage Center: 0.8%

* Note: Referrals are for medical, mental health, and substance use treatment.